 brookings.edu
Before detailing the demographic characteristics of populations of Latin American origin in the United States, it is important to frame the concept "Latin”, since it assumes a big difference to people from the Italian region of Lazio, where the city of Rome was established before the Roman Empire. Like the designation of Latin America, Latinos refers to the inhabitants of the former Iberian colonies in America, whose languages, Spanish or Portuguese, have Latin roots. Even though this definition is based on shared cultural roots, the Canadian region of Quebec, where the Latin language is also spoken, in this case, French, is not included in this definition. Latin and Latin America are closer to a geopolitical description than to common belonging. But this population, comprehended from the Anglo-Saxons, the majority ethnic group in the United States, presents itself as a homogeneous mass, given the contrast with its phenotypic characteristics.
As we advance in understanding the composition of the Latino population, we learn different segmentations due to differences in phenotypes and the great cultural diversity arising from the countries of origin. Part of this population does not fit the definition of "Latino" but of "Hispanics” due to the phenotype itself, as they see themselves as white instead of "Chicanos," with darker skin. In addition, being "Hispanic" also implies a distinction of social class because this group, often from the elite of Latin American countries, is associated with higher income strata, since the great mass of "Chicanos" makes up the lower strata of the working class in the United States.
Still, there
are other demographic features, such as the expressive portion of the African-root
Latino community from countries such as Cuba, Puerto Rico, Colombia, Dominican
Republic, Haiti, and others. This characteristic is overlaid by another
important identity, which concerns the countries of origin of each subgroup. As
we will see later, Mexican ancestry is the majority, but communities from Cuba,
Puerto Rico, El Salvador, Guatemala, Colombia, Venezuela, Brazil, and others
are expressive. In conclusion, the concept of "Latin" is very fluid.
However, it is still helpful to describe a community that organizes itself and
seeks to influence its destiny and the direction of the major power in the
world, the United States of America.
What does the
2020 Census say?
According to the Census released in September 2021, the population of the United States reached 328,239,523 people, an increase of 6.3% compared to 2010, when the estimated population was 308,758,100. Of this total, the declared white population that was not Hispanic/Latino was 60.1%, while the Hispanic/Latino population was 18.5%, and the African American population was 13.4%.
Compared to 2010, the population of Latinos grew from 50.5 to 62.1 million people. Latinos accounted for 51.1% of the country's population growth, rising to 18.5% of the US population, according to 2020 census figures. That means the Hispanic population grew 23% from 2010 to 2020. In contrast, the country's white population alone is shrinking and aging. In 2010, this portion represented 63% of the total. In 2020, this percentage dropped to 57.3%. People who identify themselves as white in combination with some other race increased by 316%. According to a CNN analysis, non-Hispanic white Americans continue to be the most prevalent group in every state except California, Hawaii, and New Mexico, as well as the District of Columbia and Puerto Rico. There are now seven states and territories - California, New Mexico, Nevada, Texas, Maryland, Hawaii, and Puerto Rico - where the non-Hispanic white share of the population is less than 50%. In California, for example, the Hispanic or Latino population officially became the largest racial or ethnic group in the state for the first time. The Hispanic or Latino community now represents 39.4% of Californians, an increase of 37.6% from 2010. The non-Hispanic white population in California was 34.7% in 2020.
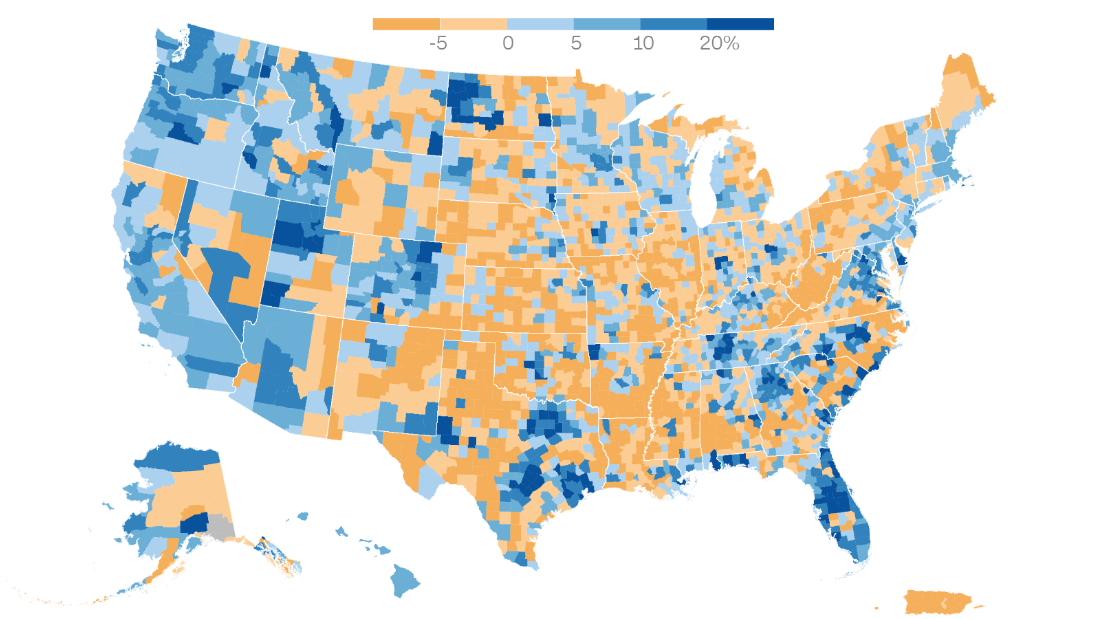
These figures reflect the great diversity and capillarity of people who do not consider themselves Anglo-Saxons, as can be seen in Figure 1 as follows:

Figure 1. Racial Diversity of the United States, 2020.
Source: CNN. Census release shows America is more diverse and more multiracial than ever
It is interesting to note that ethnic diversity spreads across most of the counties, as shown on the map. Still, the highest concentrations are located in the southern and western states of the country, such as California, Texas, Florida, New Mexico, Arizona, and Nevada. However, as shown in Figure 2, we can see that this diversity is well delimited in the counties according to the ethnic origin of the largest minority groups: Latinos and African-Americans. Also noteworthy is the characterization of counties where miscegenation in two or more races is considered.

Figure 2. Distribution of non-white ethnic groups by county in the US, 2020.
Source: Brookings Institute: Mapping America’s diversity with the 2020 census.
The African-American minority has graphic representation in former southern states, from Virginia and North Carolina to Louisiana, passing through Georgia. There is also a large concentration of African-Americans in dense metropolitan areas, such as New York, Chicago, Washington (DC), and Saint Louis.
The Latino population is concentrated in Florida and states conquered from Mexico, such as Texas, New Mexico, Nevada, Arizona, and California. Still, it is also very representative in large urban centers in the northeast, such as New York, Boston, New Jersey, and in the Midwest, as in Will County, Illinois.
One last aspect to be highlighted refers to the origin of Latino communities in the United States, as shown in Figure 3 as follows:

Fonte: Pew Research Center. Hispanic origin groups in the U.S., 2019.
As can be seen, the Mexican origin population represents the expressive majority of the Latino population in the USA, with 61.5%. It follows the people from Puerto Rico, with 9.7%. In this case, the condition of the associated state means that the inhabitants of Puerto Rico do not face migratory difficulties to the United States, unlike other origins. Next come the Cubans and Salvadorans, with 3.9% each. It is necessary to emphasize that the Cuban migrant community, at least until 2017, had a special status due to the "dry feet, wet feet" policy, which guaranteed permanence in the country to those Cubans fleeing the socialist government in Havana. Immigration from El Salvador, on the other hand, occurred after a strong earthquake that shook the country in 2001, when the Bush administration released a visa for 200,000 citizens to work and live temporarily in the US. This policy finished after the Donald Trump act in 2018.
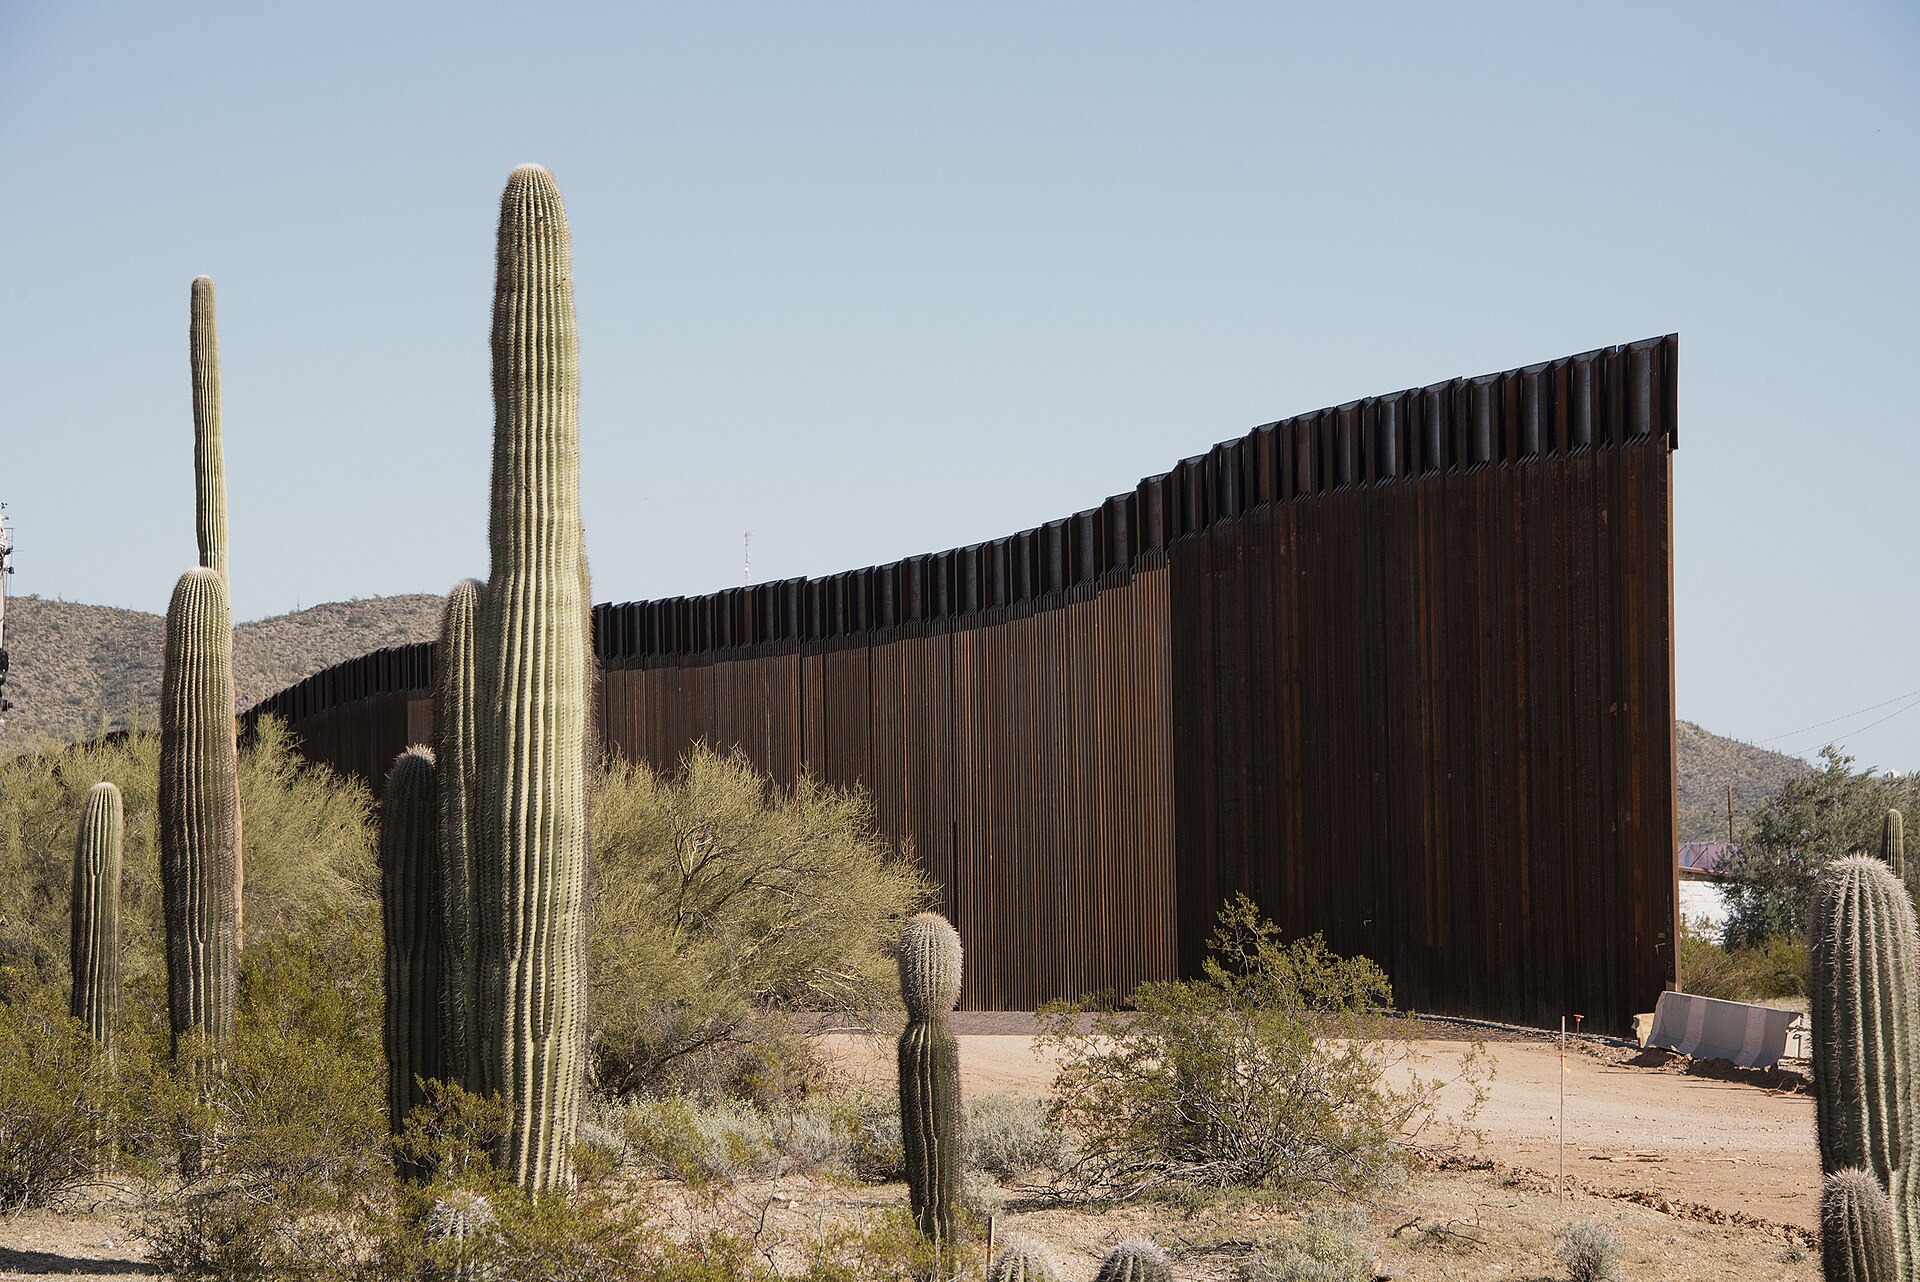
Finally, it's necessary to consider the impacts of illegal immigration from Latin America to the United States on data collected for the census. In a way, this creates a statistical difficulty in locating "undocumented" people who are kept from any US government official for fear of deportation.
The current situation on the border with Mexico, where thousands of people are concentrated, waiting for an opportunity to enter the country, gives a dimension, even if only partial, to the problem of illegal immigration. There are thousands or millions of people hiding from not only census analysts but also any social assistance and Human Rights.